Code
import numpy as np
import matplotlib.pyplot as plt

r = np.arange(0, 2, 0.01)
theta = 2 * np.pi * r
fig, ax = plt.subplots(
  subplot_kw = {'projection': 'polar'}
)
ax.plot(theta, r)
ax.set_rticks([0.5, 1, 1.5, 2])
ax.grid(True)
plt.show()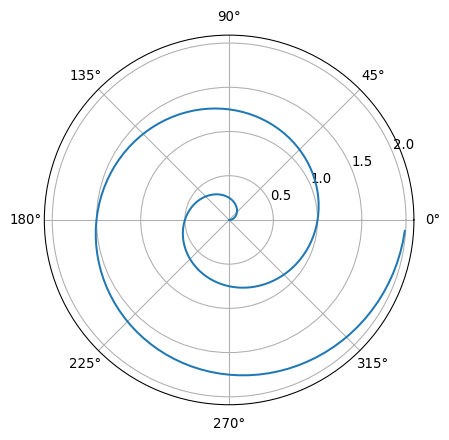
This is a book created from markdown and executable code.
See Knuth (1984) for additional discussion of literate programming.
The focus of this template is to be used in combination with Python programming. Therefore, an example code block is used below
import numpy as np
import matplotlib.pyplot as plt
r = np.arange(0, 2, 0.01)
theta = 2 * np.pi * r
fig, ax = plt.subplots(
subplot_kw = {'projection': 'polar'}
)
ax.plot(theta, r)
ax.set_rticks([0.5, 1, 1.5, 2])
ax.grid(True)
plt.show()We can also make feedback diagrams.
flowchart TD
  A(["$$\frac{\partial h}{\partial t}$$"])
  B["$$\Delta \theta$$"]
  C["$$\gamma_{\theta}$$"]
  D["$$|w_s|$$"]
  E(["$$\frac{\partial \langle \theta \rangle}{\partial t}$$"])

  A ~~~ B & C & D
  B & C & D ~~~ E

  B -.-> A

  classDef largeFontSize font-size:22px;
  class A,B,C,D,E largeFontSize;
You can also do things like adding markdown tables
| Default | Left | Right | Center |
|---|---|---|---|
| 12 | 12 | 12 | 12 |
| 123 | 123 | 123 | 123 |
| 1 | 1 | 1 | 1 |